Developer Mode (debug mode)
The developer mode (or debug mode) unlocks access to extra and advanced tools in SotaERP. There are several ways to activate the developer mode: through the settings, the browser extension, through the command palette or the URL.
Activate through the Settings
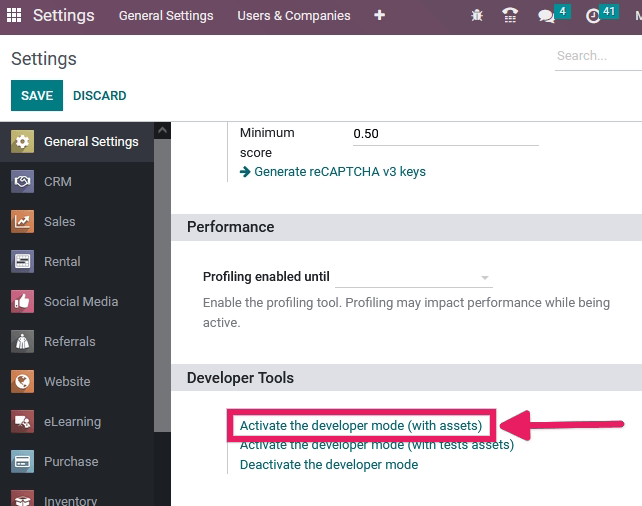
The debug mode can be activated in the SotaERP database settings. Go to and click on Activate the developer mode. At least one application needs to be installed for the Developer Tools section to appear in the Settings module.

Note
Activate the developer mode (with assets) is used by developers; Activate the developer mode (with tests assets) is used by developers and testers.
Once activated, the Deactivate the developer mode option becomes available.
Activate through the browser extension
Within a web browser, navigate to the browser settings and extensions and search for the SotaERP
Debug extension. Once the extension is installed, a new icon will be shown on the browser’s
toolbar.
For the SotaERP Debug extension, a single click enables a normal version of the mode, while a double click enables it with assets. To deactivate it, use a single click.

Activate through the command palette
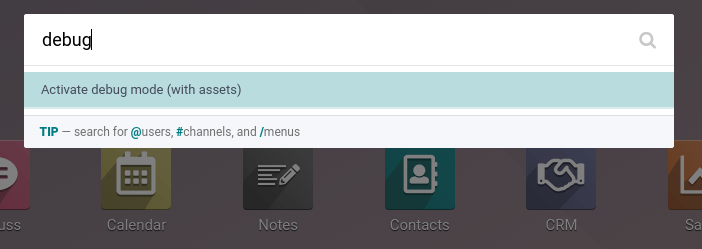
In SotaERP, the command palette tool has a command to activate the debug mode. First, open the command
palette tool with the keyboard shortcut ctrl+k and then type debug. A command will show up to
activate the debug mode.

Activate through the URL
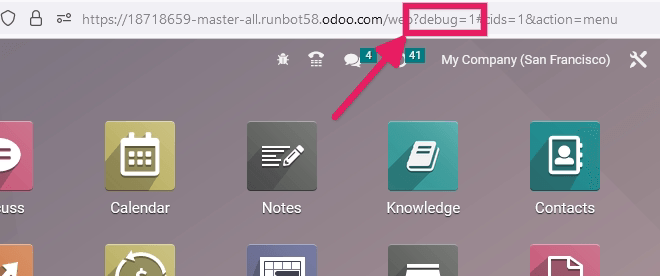
The debug mode can also be activated by adding an extra query string to the database’s URL. In the
URL, add ?debug=1 or ?debug=true after /web. To deactivate the debug mode, change the
value to ?debug=0 instead.

Tip
Additional modes are available for developers: ?debug=assets enables the
assets mode, and ?debug=tests enables
the tests mode.
Locate the developer mode tools
Once developer mode is activated, the developer mode tools can be accessed from the Open Developer Tools button, the bug icon located in the header of the SotaERP database.

This menu contains additional tools that are useful to understand or edit technical data, such as the views or actions of a page. On a page that has filters, actions, and view options, the developer mode tools contain some useful menu items such as:
Edit Action
Manage Filters
Edit the current view (e.g. Kanban, List, Graph, etc.)
See the Fields View Get